The company

Medable develops a platform for clinical trial execution, enabling patient generated data to drive clinical research, and precision and predictive medicine.

The Medable decentralized clinical trial platform is currently licensed by over 15 U.S. top medical research centers and Fortune 100 biotechnology companies, which collectively serve more than 15 million patients and conduct over 6,000 clinical trials.

Medable's mission is to expand trial access to everybody, gain end-to-end efficiencies, and streamline clinical trials with an easy-to-use platform built by clinicians and patients proven to drive precise outcomes.

Project overview

The existing way of managing study-related objects, such as eCOA instruments, was cumbersome - object creation is often done on a study-by-study basis, lacking the ability to re-use objects from one study to another.

Those who were doing this heavy lifting realized there had to be a better way, which is where the idea of the library came about - a platform for library objects, which would allow the storage, management and distribution of these objects.

Team & role

Focused on understanding the problem, immersing myself in the domain, and driving both discovery and design. Helped define the problem statement, encapsulate the solution, and from there delved into research, conceptualizing ideas, wireframing, prototyping, testing and validation - and iterating on design solutions when needed.

Role

Product Designer

Team

Josh (PM), Brianna (DM), Myself (Design), Ashwini (Research) and a team of engineers.

Tools & Methods

Figma, Figjam, Miroboard, Jira, Discovery, Research, Planning, Ideation, Design, Prototyping, Testing, UX QA

Duration

4 mo.

My design process

Followed human-centered design and lean UX design thinking process to ensure that design decisions were supported by user research, feedback and insights.

Discovery

Understanding the challenge

How things currently work

Today building and translating instruments is a time consuming process.

Each study build requires building objects like assessments and econsents from scratch — nothing is currently reusable from study to study (unless through a complex code process on the back end). Further, study templates can't be saved.

How it all can change

What if there was a system in place that could quickly deliver library objects into studies while they are being built. By accomplishing this feat, the time it takes to build a study would be vastly accelerated, thereby having a direct impact in the speed of pharmaceutical R&D.

Defining the problem

The dilemma

One of the largest burdens of time when building a study is going through the tedious process of adding library objects to a study.

Problem statement
  • Study designers need an easier way to store, manage and distribute library objects, so as to accelerate study builds and expedite the time to study startup.

Understanding the situation

Defining the problem

The dilemma

One of the largest burdens of time when building a study is going through the tedious process of adding library objects to a study.

Problem statement
  • Study designers need an easier way to store, manage and distribute library objects, so as to accelerate study builds and expedite the time to study startup.

Envisioning the solution

The Medable Global Library

A software object storage, management, and distribution platform that will allow study designers from many different studies to access library objects and add them to a study with ease.

Envisioning the solution

The Medable Global Library

A software object storage, management, and distribution platform that will allow study designers from many different studies to access library objects and add them to a study with ease.

Research

Knowing our users

It was imperative to understand who are users were, in order to understand who would be utilizing the library experience.

Study designers were our primary users, who would be using the platform on a regular basis. Object developers would be the library administrators, who would be creating and managing library objects.

Sponsors, a third user type, were not the focus of our MVP, but needed to be identified as a future use case.

User interviews

Interviews were conducted with study designers - the goal of these interviews was to spark ideation and identify current pain points these users face, as well as try to find opportunities in our platform.

The main takeways:
  • User preference showed that a list and sub-list (categories) of objects would be the most beneficial.
  • Users frequently re-use objects, so having a page or section where they can access these reusable objects would be helpful.
  • Users wanted the ability to see screenshots/preview of objects on different devices (both patient app and site app).

Planning

Affinity mapping

Once we had collected data from user intervews, we better understood how these users imagined the library experience and learned opportunities we could tackle. The next step was generating an affinity map - clustering similar insights into groups, which allowed us to set the requirements for MVP by identifying priorities and gauging impact/effort.

Features and prioritization

After feature ideation, we were able to create a priority matrix to help us identify what our requirements would be for MVP. Our focus was on the value to the user, as well as the resources and effort required on our part. We knew that we would not be offering everything desired for MVP, so we focused on value and feasibility to set requirements that would help solve the problem we started with.

Defining MVP requirements

We then decided on the requirements we needed for MVP. We were focused on providing the minimal set of requirements to achieve an impact, and so for MVP, we focused only on a single category within the context of the library ecosystem: eCOA instruments (electronic clinical-outcome assessments).

MVP requirements:
  1. Library landing page.
  2. Library master list.
  3. Library category list.
  4. Library object profiles.
  5. Ability to request approval for use of an object.
  6. Ability to report an issue with an object.
  7. Ability to add an object to a study.

Mapping the flows

Before starting on wireframes, user flows were established to understand the user’s journey. Both basic flows (connecting A to B) and advanced flows (showing processes such as error states) were generated.

* User flows were created and iterated on in Figjam. This allowed the team and SMEs to access the flows at their leisure and leave comments, vote, etc ...

Design

Mid-fi wireframing

Mid-fidelity wireframes were created to validate the layout and organization of library content. The key takeaways from testing was to gain insights into how information was organized for ease-of-use and to better understand and flesh out user flows.

* For the purpose of mid-fi wireframes, the top and side navigation were purposely left out, in order to ensure the focus of the user was on what we were testing for - layout, organization of information and user flows.

Gathering user feedback

A few insights were learning from testing with users.

  • Insight: Users wanted the ability to add an object directly from the library object list page.
  • Insight: Users collectively felt that the preview within the object's profile page was distracting. The toggle button allowing them to show/hide the preview was helpful, but in the end, it required extra effort from the user to hide.
  • Insight: When adding an object to a study, users want to be able to add it to one or more studies, all at the same time.
  • Insight: The library home page would require an iteration on design, as users felt they required a more dashboard-like approach, whereby they could see version updates and newly added library objects.
  • Other thoughts: Frequently used was identified as an important organization technique, as often, objects are reused. In fact, this insight was learned from an A/B test that was conducted to compare a list/table view versus a grid/card view). You can view a little about that A/B test here.

Hi-fi prototyping

High-fidelity wireframes were designed leveraging our design system. Interactive prototypes were then created to utilize for usability testing sessions.

Validation

Usability testing

We were able to address key pain points identified by users and design solutions, which were validated.

Pain point: Users wanted the ability to add an object directly from the library object list page.

Design solution: The solution was implemented into the table design - allowing users to select one or more rows, and then actively add those objects to a study.

Pain point: Users collectively felt that the preview within the object's profile page was distracting.

Design solution: Removed the dual-screen from the object profile page, and placed the object preview/screenshots within a separate tab.

Pain point: When adding an object to a study, users want to be able to add it to one or more studies, all at the same time.

Design solution: The solution added a component to the "Add to study" modal, which would by an autocomplete component that would allow users to select multiple studies.

Pain point: The library home page would require an iteration on design, as users felt they required a more dashboard-like approach.

Design solution: Iterated on the library home page design, adding sections for frequently-used, newly added objects and a change log (version updates).

  • New pain point discovered: Users want to be able to add specific objects to specific studies, and then other objects to other studies.
  • Proposed design solution: The modal component would not be a sufficient pattern to alleviate this pain point. Instead, an idea that came about during research was brought back to light. Some sketches had already been explored, and the task was to build out this concept and test the assumption that this would rectify this particular pain point the user was facing.

Revisiting a concept

From insights gained during research, ideation led to the concept of a shopping cart experience. Feasibility constraints limitied exploration on this concept, but learning of its importance to the library experience, it was revisited.

Revisiting a concept

From insights gained during research, ideation led to the concept of a shopping cart experience. Feasibility constraints limitied exploration on this concept, but learning of its importance to the library experience, it was revisited.

Iterating on design

Since this concept would help rectify the pain point users identified, the drawer component was revisited and integrated into the library experience..

The inital step was to explore the anatomy of the drawer and then implement it within our library designs.

Validating the solution

Circling back to testing, we were able to learn over a few days that this design solution validated our assumptions, and greenlit it as the new pattern for adding library objects to a study within the library platform.

Impact

Results & key learning

Results

How would we measure success?

We determined during discovery how we would measure success. The time it took to add all protocol-related eCOA instruments to ten studies. We were able to generate a baseline measurement that we would test against (90 day checkpoint) after the launch of the library MVP. If this time decreased, the library platform would prove fruitful and successful.

Baseline: 7.2 days

What was the purpose of this measurement?

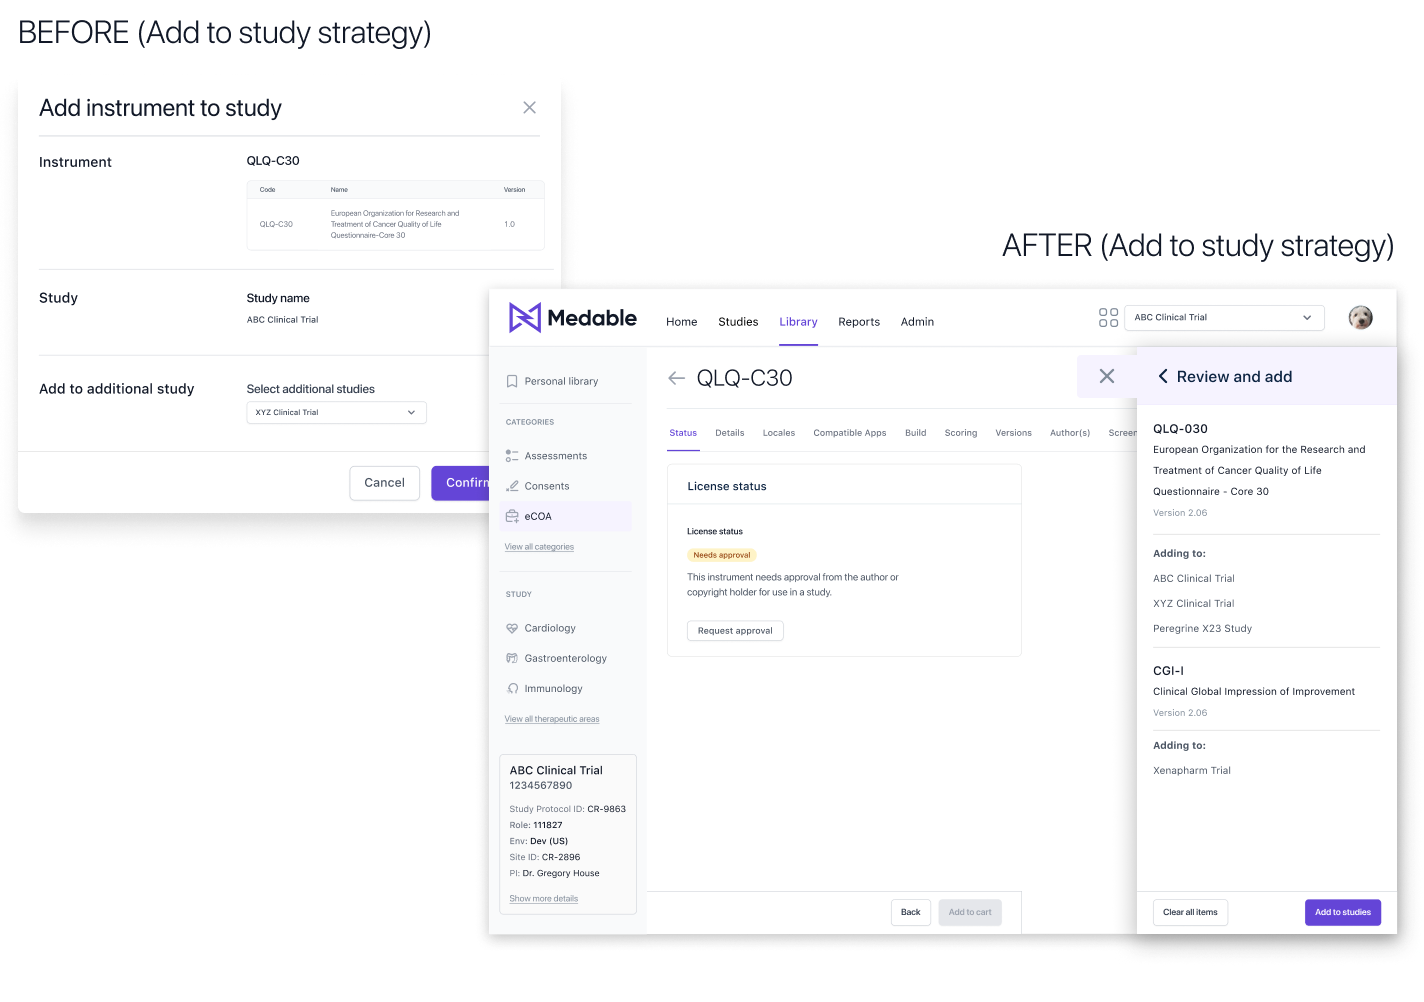
The purpose of this measurement was simple: Decreasing the time it took to add all protocol-related eCOA instruments to a study would be directly correlated with the total time to build a study - which would expedite the time it took to startup a study.

What did we find?

The time it took to add all protocol-related eCOA instruments to ten studies decreased by 63%.

Did we solve the problem?

An emphatic yes! We were able to show the value of the library in reducing the time it took to build a study, thereby proving the impact the library would have in accelerating pharmaceutical R&D.

A key learning was:

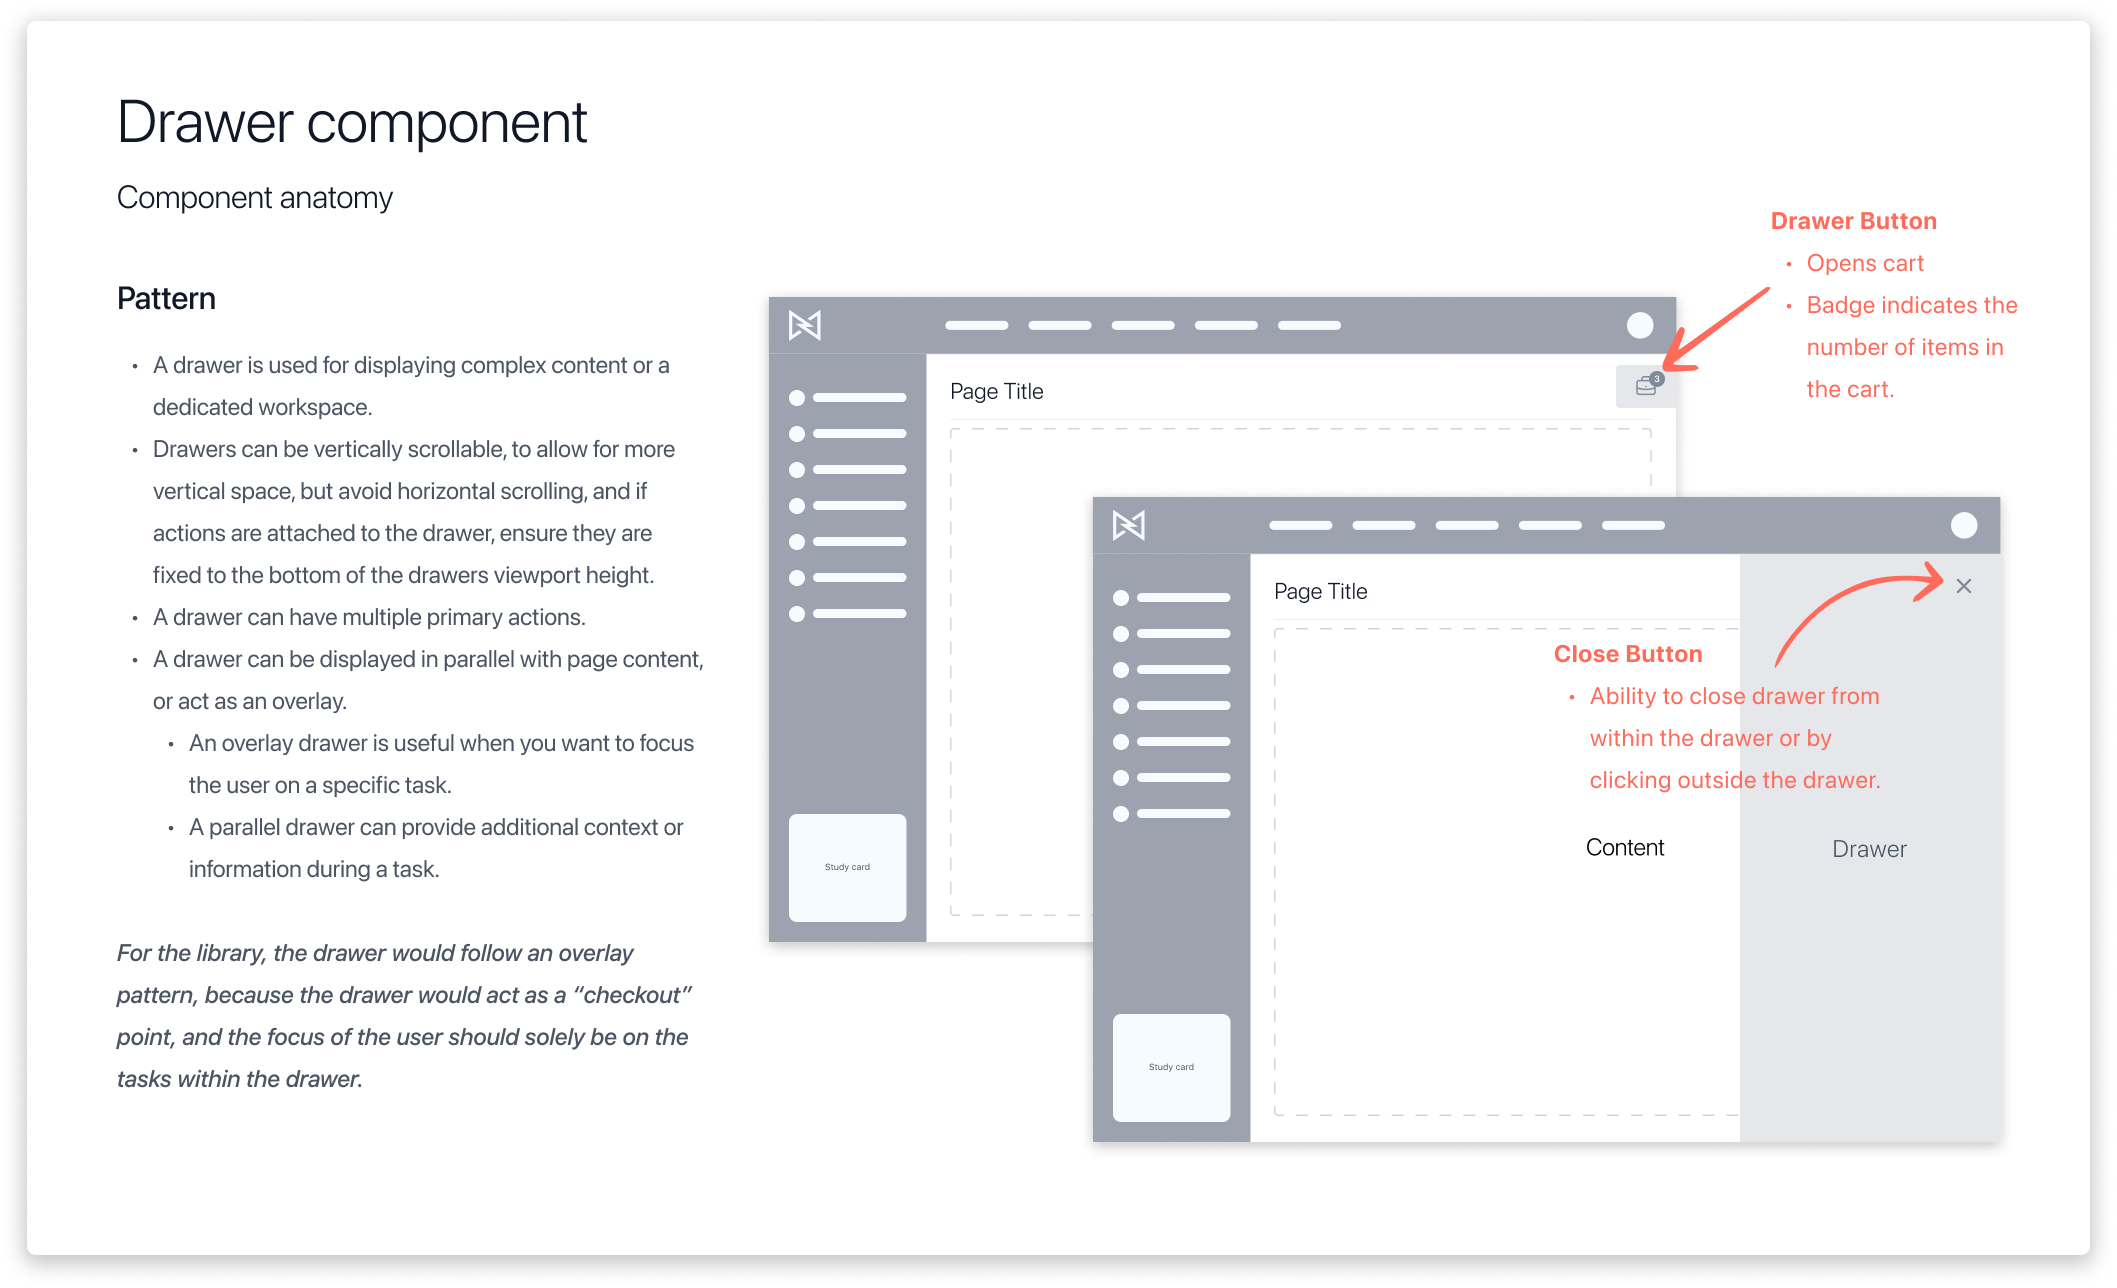
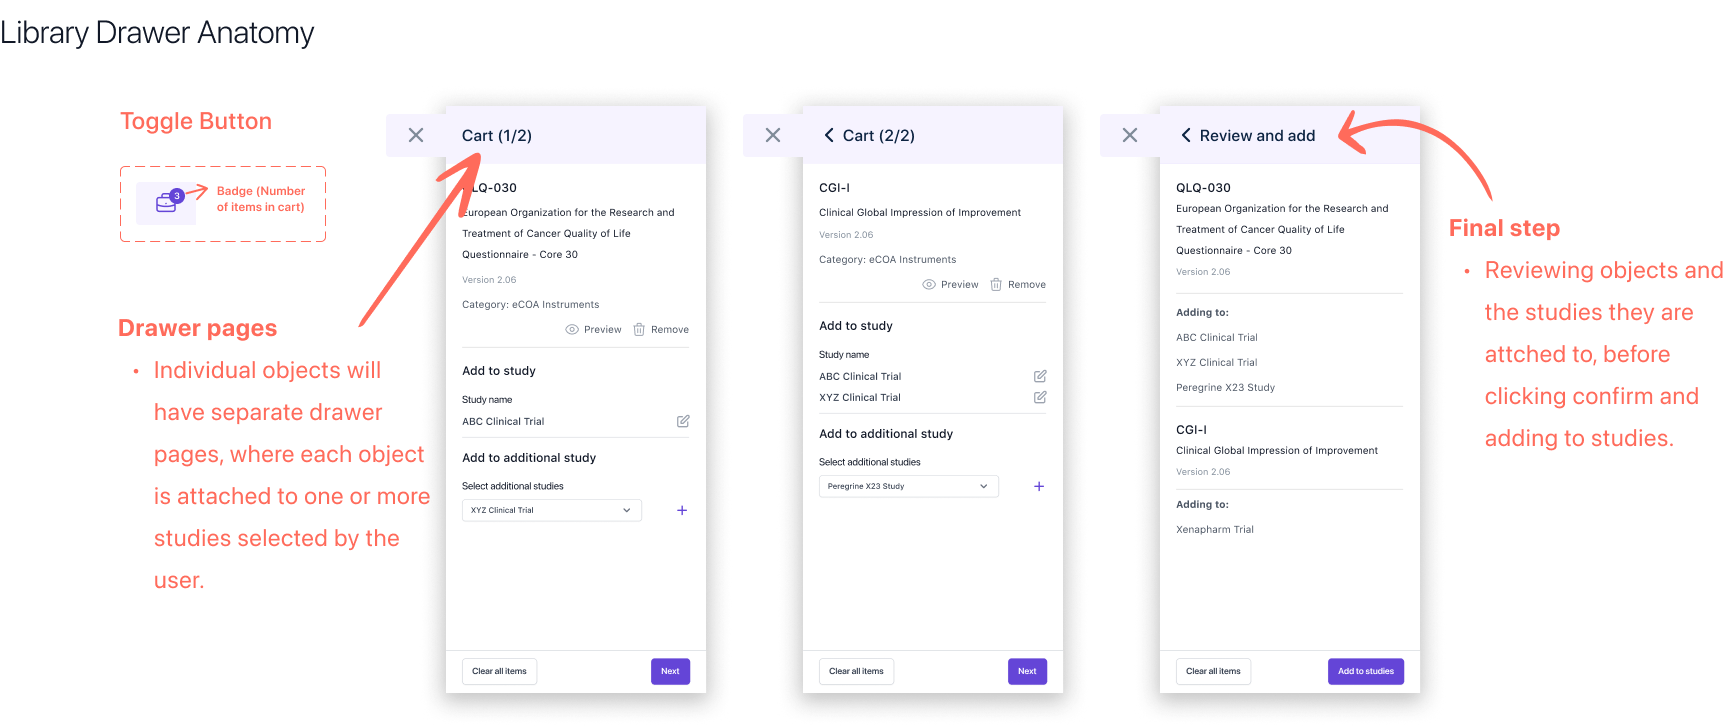
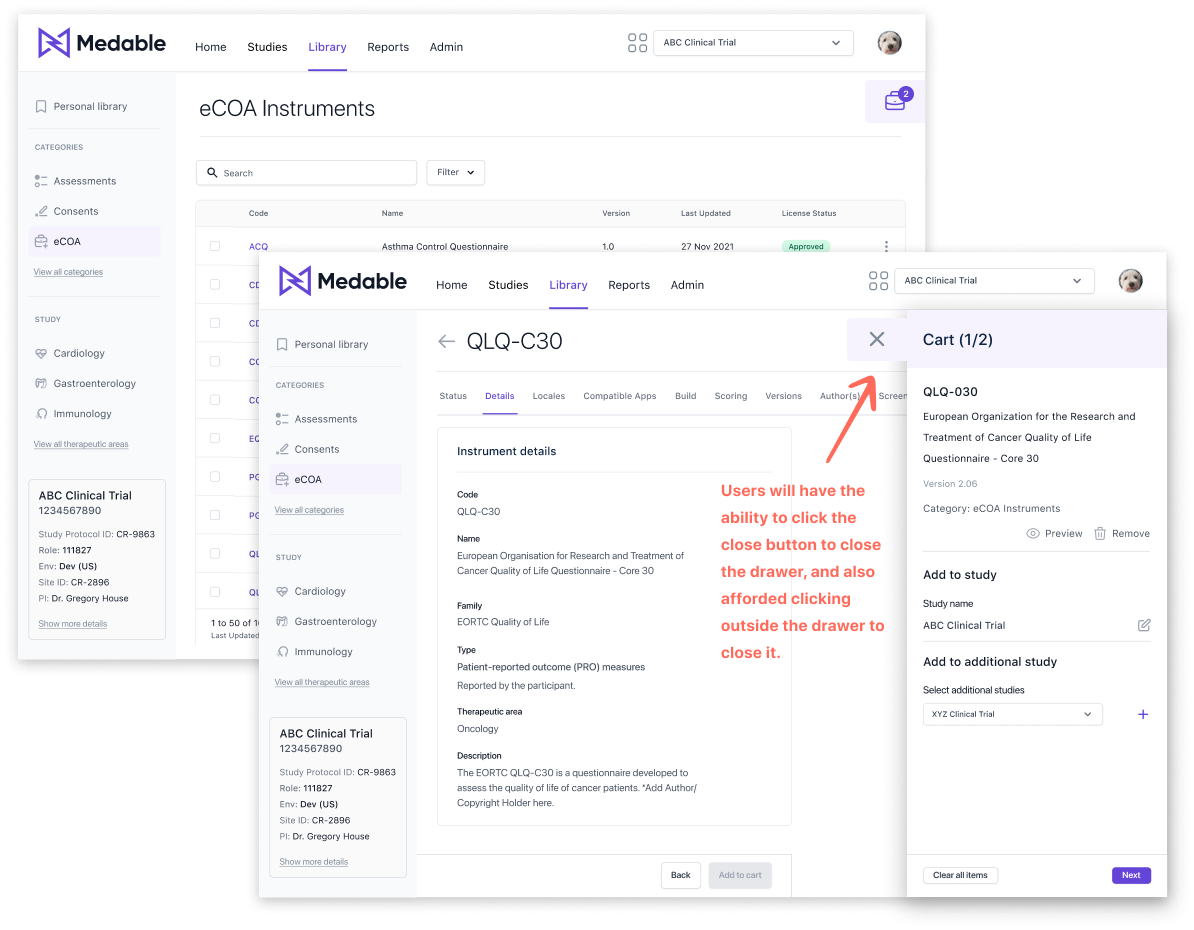
  • Being a founding member of our Design System team allowed me the fortune of cherry-picking components for release that coincided with library needs. The drawer component was initially being built out in our design system, however, I quickly learned that it was a "one-and-done" solution for the library alone, and not required as a pattern in other projects. Therefore, I left it out of the design system (keep it lean!) and let the strategy live locally within the library. Of course, if the need arose where it was required elsewhere, it would be an easy effort to introduce it within our design system.